Pinal Dave
1) SQL SERVER – How to DROP or DELETE Suspect Database?
SOLUTION/WORKAROUND
As we can see above, one we start
SQL Service, the database goes through recovery and its failing there. Due to
this, we were not able to drop the
database. I have not seen this earlier as I was always able to drop such
databases for restore. Here are the steps we did to drop the database and
perform the restore:
- Stop the SQL
Server service.
- Take a safe copy
of existing MDF/NDF and LDF files.
- Rename the file
(MDF or LDF or both) related to this database.
- Start the SQL
Server service.
Since the files are not available
the database startup would fail, and the database would go to “Recovery Pending” state. After this, we
were able to drop the database. As I mentioned they were ready to restore it
from the backup and it worked well.
2)SQL SERVER –
Running CHECKDB with Minimum Repair Level
Here is the error message and guidance.
CHECKDB found 0 allocation errors and 39
consistency errors in database ‘MegaMart-AWS’.
repair_allow_data_loss is the minimum repair level for the errors
found by DBCC CHECKDB (MegaMart-AWS).
Now what is the correct way to run DBCC
CHECKDB with minimum repair level.
USE [master];
GO
ALTER
DATABASE MegaMart-AWS SET SINGLE_USER WITH ROLLBACK
IMMEDIATE;
DBCC CHECKDB(N’MegaMart-AWS’,
REPAIR_ALLOW_DATA_LOSS);
ALTER
DATABASE MegaMart-AWS SET MULTI_USER;
3) SQL SERVER
– Always On Availability Groups and Full-Text Index
THE PROBLEM
One of my clients to whom I
helped in configuring Always On Availability Groups
came back to me with an interesting situation. They have observed blocking of reading queries on the
secondary replica. Since the database is in read-only mode, they wanted to know
how write is being performed in the database which is causing blocking?
THE
INVESTIGATION
I knew that this is not a user
write activity but must be a system write activity which is causing blocking.
When I started troubleshooting, I found below.
- DB STARTUP thread (redo thread) being blocked by user
session in sys.dm_exec_requests
- Wait type: LCK_M_SCH_M
- Wait_resource:
METADATA: database_id = 8 COMPRESSED_FRAGMENT(object_id =
484196875, fragment_id = 9715700) – found using sys.all_objects
When
I looked further, I found the object name was
ifts_comp_fragment_484196875_10739738 and it was an INTERNAL_TABLE.
THE SOLUTION
It became clear that the redo thread was getting blocked not a user
session. This causes the replica to start lagging because redo stops often.
In my lab, I also observed that if a database with a full-text index is in an
availability group, we can see the same type of blocking whenever the full text
is index is enabled for automatic or manual population, and if there are read
queries running full-text searches.
For my client, we were able to
prevent this behavior by disabling change tracking. My client was OK with
disabling change tracking on the full-text index temporarily and then setting
up an incremental population on a schedule. Here is the T-SQL to change the tracking to manual.
|
1 2 3 4 |
|
Later I suggested my client to
refer Populate Full-Text Indexes and think about
“Incremental population based on a timestamp”. This was a long-term solution
for them.
4) How to Find
Longest Running Query with Execution Plan
Answer: This is a very popular question I see in
SQL Server Interview Questions and Answers. SQL Server stores all the data for
query execution in DMVs inside it. The DMVs are reset when SQL Server services
restart. Let us see a quick query which returns us longest run query with its
execution plan.
SELECT TOP 10
t.TEXT QueryName,
s.execution_count
AS ExecutionCount,
s.max_elapsed_time
AS MaxElapsedTime,
ISNULL(s.total_elapsed_time /
1000 / NULLIF(s.execution_count, 0), 0) AS AvgElapsedTime,
s.creation_time
AS LogCreatedOn,
ISNULL(s.execution_count /
1000 / NULLIF(DATEDIFF(s, s.creation_time, GETDATE()), 0), 0) AS FrequencyPerSec
,query_plan
FROM sys.dm_exec_query_stats s
CROSS APPLY sys.dm_exec_query_plan( s.plan_handle ) u
CROSS APPLY sys.dm_exec_sql_text( s.plan_handle ) t
ORDER BY MaxElapsedTime DESC
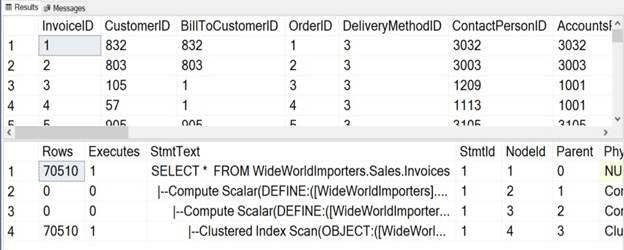
If you run above query it
will return us resultset in the SSMS.
Scroll all the way to the right side and you will notice that there is a column
called Query_Plan. This is the column which displays
the execution plan of the query. Click on it and it will bring up SQL Server
Query Plan in SSMS. Once you have an access Query Plan, you can also send
that via email to your friend
5) Different
Ways to Explore Actual Execution Plans
Method 1:
Graphical Actual Execution Plans
You can enable Graphical actual
execution plan via typing keyboard shortcut CTRL+M.
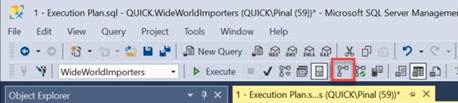
In SSMS you can also enable a
graphical execution plan via clicking on the icon on the toolbar.
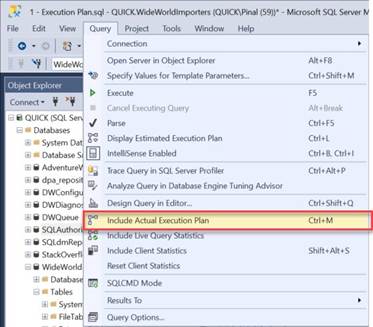
If you go to
the Main Menu on the top go-to Query menu and click on the Include Actual Execution Plan.
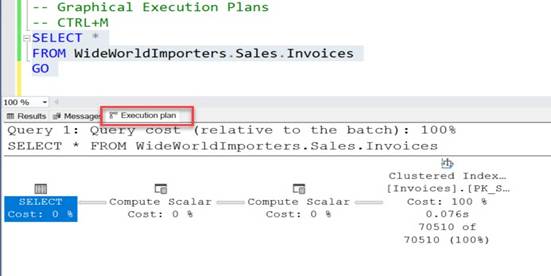
Once you follow any one of the above advice,
you can run any query in the query editor in SSMS and it will display actual
execution plan in the separate window in your SSMS resultset.
Once you are looking at your execution plan, you can follow
the same method to disable the execution plan.
Method 2: Text
Plan
This is another method to see the execution plan. We will use
the STATISTICS PROFILE to see the actual execution plan.
You can execute the following query and in the resultset area, you will see the execution plan in the text
format.
|
1 2 3 4 5 6 7 8 |
|
You need to scroll down below the
execution plan to see the text-based execution plan which will be displayed in
the grid format.
6) SQL SERVER
– Cleanup Plan Cache for a Single Database
During my recent Comprehensive Database Performance Health Check, we had implemented quite a few improvements
in the database. After making the improvements in the database, we reached to
the point where we needed to clear the
cache of the server to see how our improvements fairs with the changes
which we have made.
While we were discussing
about the clearing the cache, the senior DBA at the organization, in rush
immediately jumped to the Query Editor in the SQL Server Management Studio
(SSMS) and wrote down following command.
|
DBCC
FREEPROCCACHE |
As soon as I saw him writing down the above command, I told him
to stop immediately and explained that if he ran above command on the server it
will drop the plan cache for the ALL the
database on the server and that is something not recommended. If drop the
plan cache for all the server, during the business hours, SQL Server will be under pressure to re-create all the plans and it
may negatively impact the performance as well.
As we had made improvements in a single database and our need
was to clear the cache for a single database and hence, here is the command to
remove the cached plans for a single database only.
|
1 2 3 |
USE DatabaseToClearCache; DECLARE @dbid
INT
=
DB_ID(); DBCC
FLUSHPROCINDB (@dbId); |
If you are using SQL
Server 2016 or later version, you can also run the following command:
|
1 2 |
USE DatabaseToClearCache; ALTER DATABASE SCOPED CONFIGURATION
CLEAR PROCEDURE_CACHE |
Well, that’s it. It is very simple to remove the cache for a
single database, I strongly suggest that you only do it in the extreme
conditions, as in most of the cases, you do not need it.
7) SQL SERVER
– FIX: Msg 15274 – Access to the Remote Server is Denied Because the Current
Security Context is not Trusted
While working with a client, I
encountered few errors while using linked server and I am going to share my
solutions via a few blog posts. In this blog we would talk about fixing error 15274 – Access to the remote server is
denied because the current security context is not trusted.
Before I talk about the problem and
the solution, I must share a few environment details.
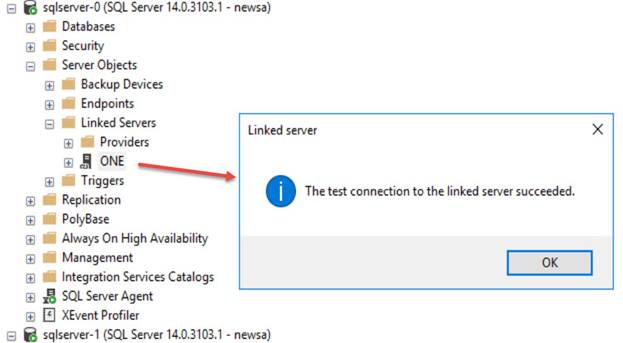
Remote Server
Error
In my lab, I got two servers
SQLSERVER-0 and SQLSERVER-1. The linked server was created on SQLSERVER-1 which
was given name as ONE, connecting to SQL SERVER-1. There are two databases
involved here. On source server (SQLSERVER-0) I have a database called SQLDB0
and on destination (SQLSERVER-1), a database is called SQLDB1.
1)
Linked server “test connection” was working
just fine.
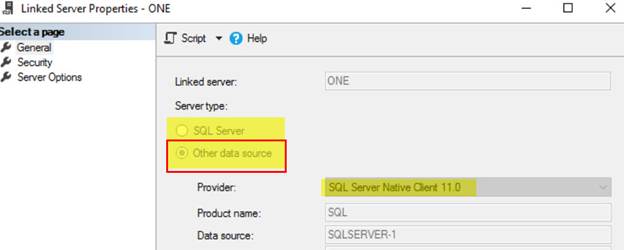
2) Linked server was not created using “SQL Server”
option, but “Other data source” was used before application wanted to use a
different name.
3)
Simple queries were
working fine but a stored procedure which was using “execute as user” was
failing.
Here
is the error which was coming when we were executing a stored procedure. Here
is an oversimplified version of the stored procedure. The procedure is created
in database SQLDB0.
|
CREATE PROCEDURE usp_fetch_data AS BEGIN EXECUTE AS user = 'user_no_login' SELECT * FROM One.SQLDB1.dbo.Table_1 REVERT END |
And here is the error message when I execute it as below.
Here is the text of the error message.
Msg 15274, Level 16, State 1, Procedure usp_fetch_data,
Line 5 [Batch Start Line 9]
Access to the remote server is denied because the
current security context is not trusted.
I captured profiler
trace but found nothing interesting. Since error message was talking
about “TRUSTED”, I recalled TRUSTWORTHY property of the database.
WORKAROUND/SOLUTION
My feeling was correct. As soon
as I changed the database property on the source database, the above error
disappeared. Here is the T-SQL to check the property.
|
1 2 3 4 |
|
If you see is_trustworthy_on
set as 0 (ZERO) then run below command to enable it and make it 1 (ONE).
|
1 2 |
|
8) How to
Track Autogrowth of Any Database?
Question: How to Track Autogrowth
of Any Database?
Answer: Just the other day during the Comprehensive Database Performance Health Check, we identified that the SQL Server Performance
problem of the user was because of the constant Autogrowth
of their main database which ran lots of e-commerce orders.
We put our database under observation and figured out a high
amount of activities during a certain period of the time and along with that
also noticed that we have an ETL job running at the particular
time which overlapped some busier time of the database.
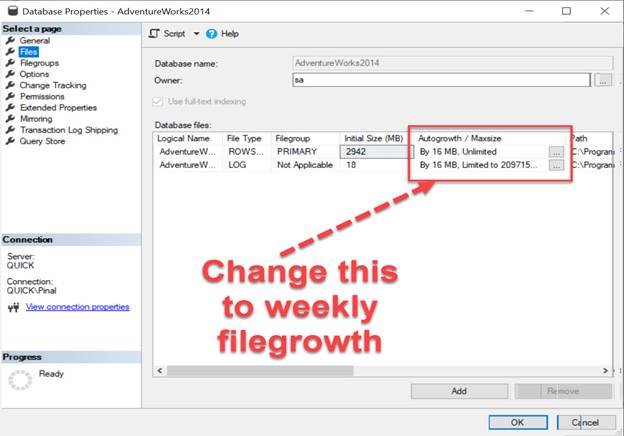
We finally decided to put a trace flag to identified when and
who did the autogrowth for the database. Once we
identified the issue, we increased the value of the auto growth for
database files and eventually resolve the problem. Here is the configuration
setting where we can increase the autogrowth settings
for database files.
9) SQL SERVER
– Script – When/Who did Auto Grow for the Database?
What happens when you try to copy a large file from different
hard disks? The operating system tries to see if the destination location has
enough space available for the copy to be successful. If we don’t have enough
space, then it is second to human nature to make space and restart the copy
operation. I am sure most of us who use USB drives have done this task. If you
look at SQL Server, it does a similar act. When there is no space in the file
while writing, SQL Server goes ahead and expands the file based on our
configuration. But if you are a seasoned DBA, you would want to know when these
expansions happen. This blog is inspired by a question asked by one of the blog
readers. All these questions are a major source of my blog content. Recently I
received below email:
We see the database file
size getting increase automatically every day. We are not having many active
users, or transactions in the database. I read your blogs and understood that
this might be due to auto grow setting of the database. Is there any way to
find “who” is doing it?
The problem is half solved if we
understand the reason. DBA has already nailed it down till auto growth and to
help my reader further I provided him below script to find the auto growth
events happen on the server. This information is pulled from Default Trace
which runs by default on every SQL Server installation.
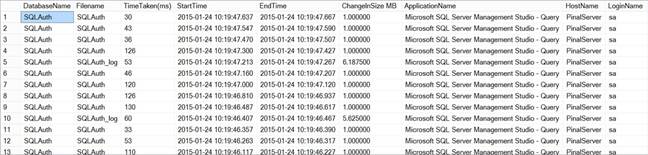
Here is the script to get the
auto grow events which happened of database “SQLAuth”.
Please change it as per database name in your environment
DECLARE @current_tracefilename VARCHAR(500);
DECLARE @0_tracefilename VARCHAR(500);
DECLARE @indx INT;
DECLARE @database_name SYSNAME;
SET @database_name = 'SQLAuth'
SELECT @current_tracefilename = path
FROM sys.traces
WHERE is_default = 1;
SET @current_tracefilename = REVERSE(@current_tracefilename);
SELECT @indx = PATINDEX('%\%', @current_tracefilename);
SET @current_tracefilename = REVERSE(@current_tracefilename);
SET @0_tracefilename = LEFT(@current_tracefilename, LEN(@current_tracefilename)
- @indx) + '\log.trc';
SELECT DatabaseName
,Filename
,(Duration / 1000) AS 'TimeTaken(ms)'
,StartTime
,EndTime
,(IntegerData * 8.0 / 1024) AS 'ChangeInSize MB'
,ApplicationName
,HostName
,LoginName
FROM::fn_trace_gettable(@0_tracefilename, DEFAULT) t
LEFT JOIN sys.databases AS d ON (d.NAME = @database_name)
WHERE EventClass >= 92
AND EventClass <= 95
AND ServerName = @@servername
AND DatabaseName = @database_name
AND (d.create_date < EndTime)
ORDER BY t.StartTime DESC;
To test the script, you can
created a dummy database, insert some rows so that auto growth is caused. Then
check the report.
CREATE DATABASE [SQLAuth]
GO
ALTER DATABASE [SQLAuth] SET RECOVERY FULL
GO
BACKUP DATABASE [SQLAuth] TO
DISK = 'NUL'
GO
USE [SQLAuth] GO
CREATE TABLE PinalDave (Pinal INT ,Dave CHAR(8000))
GO
SET NOCOUNT ON
GO
DECLARE @i INT
SET @i = 1
WHILE @i < 10000
BEGIN
INSERT INTO PinalDave
VALUES (1,'Pinal
Dave')
SET @i = @i + 1
END
Here is the output of the
script which shows the growth event details.
10) SQL SERVER
– Detecting CPU Pressure with Wait Statistics
Last week, I had a very interesting situation where client
believed they had an issue their slow running server. They sent me a few
initial details about their server and after looking at that I told them that
they have a CPU pressure issue. They were very surprised as to how did I know
that information in such a little time. I eventually expressed them it is possible
to detect CPU pressure with Wait Statistics
Here is the script which can help you to identify if there is
a CPU pressure or not with the help of SQL Wait Statistics.
-- Signal Waits for instance
SELECT CAST(100.0 * SUM(signal_wait_time_ms) / SUM (wait_time_ms)
AS NUMERIC(20,2))
AS [%signal (cpu) waits],
CAST(100.0 * SUM(wait_time_ms - signal_wait_time_ms) / SUM (wait_time_ms)
AS NUMERIC(20,2))
AS [%resource waits] FROM sys.dm_os_wait_stats OPTION (RECOMPILE);
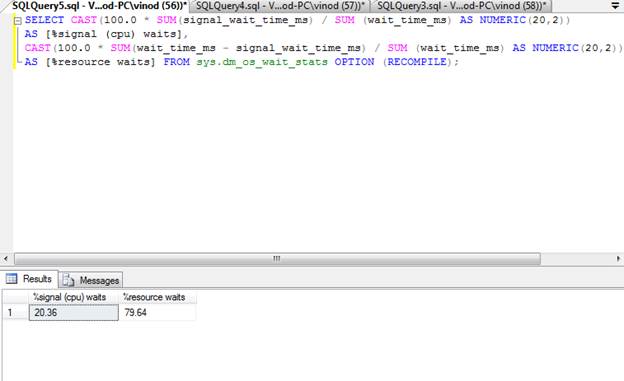
Higher the Signal wait stats are
not good for the system. A very high value indicates CPU pressure. In my
experience, when systems are running smoothly and without any glitch, the
Signal wait stat is lower than 20%. Again, this number can be debated. In other
words, lower is better and higher is not good for the system.
When my client sent me the result
of the above statement, the value of Signal Wait Time was around 75%, I am very
confident that it is very high value and leading to SQL Server Performance problems.
Once we get on consulting call, we spent next 2 hours to
identify the CPU bottleneck and removing it from the system. The problem which
was blocking the CPU to be used efficiently was very simple, once we fixed it,
their system started to run extremely fast.
11) SQL SERVER
– Measure CPU Pressure – Detect CPU Pressure
Many a time, DBAs face the
following question: can the CPU handle the current transaction? I have seen
many DBAs getting confused about whether they should get a CPU with higher
clock speed or more number of CPUs when it is time to upgrade the system. As
we all know, the CPU (or the Central Processing Unit) is the core of any
system. The CPU is responsible for not only SQL Server operations but also all
the OS (Operating System) tasks related to the CPU on the server. Let us
learn about how to measure CPU Pressure.
It is quite possible that
although we are running very few operations on our SQL Server, we still do not
obtain the expected results. This is when the SQL Server CPU has to be checked.
Again, please note that I am not suggesting that the CPU is the root cause of
poor performance in this case. There are ample chances that the Memory, Input/Output or Tempdb can be
responsible for performance degradation. However, to find out the “real”
culprit, we must run a test; here, we intend to start running tests on the CPU.
Let us understand the simple
meaning of CPU pressure. CPU pressure is a state
wherein the CPU is fully occupied with currently assigned tasks and there are
more tasks in the queue that have not yet started.
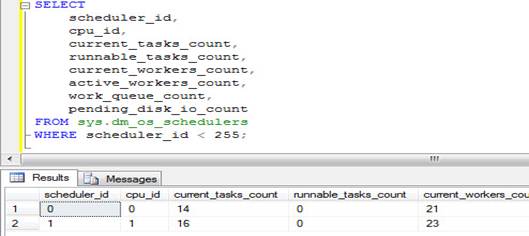
We can run several different types of queries to test the CPU.
However, my personal favorite is the following one. The resultset
will contain as many rows as those being used by the CPU SQL Server.
|
1 2 3 4 5 6 7 8 9 10 |
SELECT scheduler_id, cpu_id, current_tasks_count, runnable_tasks_count, current_workers_count, active_workers_count, work_queue_count, pending_disk_io_count FROM sys.dm_os_schedulers WHERE scheduler_id < 255; |
Above query will give result something like following.
Before we go ahead, let us
familiarize ourselves with the terms. First of all, we should understand what a
“scheduler” refers to in the SQL Server. Each SQL Server instance behaves and
acts like any OS internally. It has schedules and also it synchronizes
concurrent tasks by itself without going to OS. Each instance can handle many
concurrent requests. However, there is a point at which the instance cannot
accept any more requests. SQL Servers have a dynamic management view (DMV),
which in fact keeps a log of all the schedule-related tasks and also it
provides a good idea about the CPU pressure.
current_tasks_count is the
number of counts of the currently running task. However, we should give the
utmost consideration to runnable_tasks_count. If this
number is higher, it indicates that a large number of queries, which are
assigned to the scheduler for processing, are waiting for its turn to run. This
gives a clear indication of the CPU pressure. Additionally, count pending_disk_io_count displays the tasks that are yet to be
processed in the scheduler. For better processing, this count is expected not
to be very high.
When we say that the numbers are
high or low, it does not make any sense unless we compare it to a standard or
any other known count. Therefore, here, these numbers are compared to the
worker counts (current_worker_count). If current_worker_count is 24 and there are 1000 tasks in
queue, then this is not a good scenario. Thus, you can always look at the
numbers and make your own judgment here.
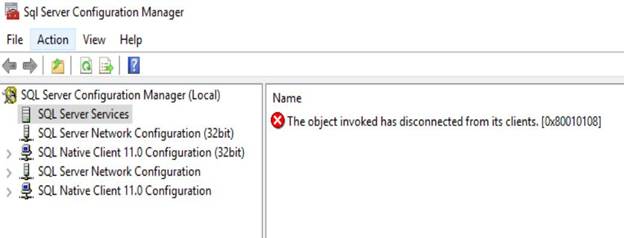
12) SQL SERVER
– SQL Server Configuration Manager Error: 0x80010108 – The Object Invoked Has
Disconnected From its Clients
While writing my previous blogs
about SQL Server Configuration Manager, I encountered another error. In this
blog, we would learn one of the possible causes of error 0x80010108 – The
object invoked has disconnected from its clients.
Here is the screenshot of the
error message.
WORKAROUND/SOLUTION
When I searched for the hex code
on the internet, it was saying RPC_E_DISCONNECTED and looks like that is the
code of the text of the message. When I looked back at the series of action I
did, the error was reproducible.
- Open SQL Server Configuration Manager
(SSCM).
- Click on SQL Server Services to view the
list of services.
- Stop Windows Management Instrumentation Service
using Services applet (Start > Run > Services.msc)
- Switch back to SSCM and refresh the
services.
- You should see the error “The object invoked has
disconnected from its clients. [0x80010108]”
Once you close and reopen SSCM,
it should automatically start WMI service and we should be able to see the list
of services again.
We simulated the error by
stopping WMI Service manually. So, whenever you see such error with SQL Server
Configuration Manager, you should figure out why WMI service was stopped. You
can start with Event Viewer to know if there are any other interesting events.
13) When
was Table Accessed Last By User?
When you run the following
query, it will give you essential information about the table seek, table scan,
table lookup as well as table update. Looking at the report we can decide which
table is the busiest table for your customer and how you can start attacking
the busiest table to get maximum performance.
SELECT DB_NAME(ius.[database_id]) AS [Database],
OBJECT_NAME(ius.[object_id]) AS [TableName],
MAX(ius.[last_user_lookup]) AS [last_user_lookup],
MAX(ius.[last_user_scan]) AS [last_user_scan],
MAX(ius.[last_user_seek]) AS [last_user_seek],
MAX(ius.[last_user_update]) AS [last_user_seek]
FROM sys.dm_db_index_usage_stats AS ius
WHERE ius.[database_id]
= DB_ID()
--AND ius.[object_id] = OBJECT_ID('YourTableName')
GROUP BY ius.[database_id],
ius.[object_id]
13) SQL SERVER
– Event ID 1069 – Unable to Failover Clustered Instance to Another Node.
Resource is not Loaded
While playing with my lab cluster,
I ran into a situation. In this blog, we would learn about a situation where
failover was not working from one node to another node. Everything used to work
fine on Node1. Let us fix the error related to failover clustered.
Errors from System Events logs:
01/04/2018 04:02:16 PM
Error
1069
Microsoft-Windows-failoverclustering
Cluster
resource ‘SQL Server (InstA)’ of type ‘SQL Server’ in
clustered role ‘Instance_A’ failed.
01/04/2018 04:02:19 PM
Information
7036
Service
Control Manager
The SQL
Server (InstA) service entered the running state.
01/04/2018 04:04:04 PM
Information
7036
Service
Control Manager
The SQL
Server (InstA) service entered the stopped state.
System Events logs pretty much
showed generic errors so, I moved on to the cluster logs and isolated to the
timeline when I tested the failover. Here is my earlier blog to learn how to
generate cluster logs.
Errors from cluster log.
Remember that by default time is in UTC time-zone. In Cluster log, ERR and
WARN are generally the interesting messages. The above-highlighted error was
very interesting. And when I spent more time in the cluster log, I unearthed
these below errors:
0000173c.000029f4::2018/04/01-11:32:16.564 ERR [RHS] s_RhsRpcCreateResType: (126)’ because of ‘Error loading
resource DLL sqagtres.dll.’
00000ffc.000027d8::2018/04/01-11:32:16.564
INFO [RCM] result of first load attempt for type SQL Server Agent: 126
0000173c.000029f4::2018/04/01-11:32:16.604
ERR [RHS] s_RhsRpcCreateResType: (126)’ because of
‘Error loading resource DLL sqsrvres.dll.’
00000ffc.000027d8::2018/04/01-11:32:16.604
INFO [RCM] result of first load attempt for type SQL Server: 126
Both the errors found above are
talking about a possible faulty resource DLLs for SQL Server resources. We can
see number 126 which is the error code. As we can see below, error number 126 =
The specified module could not be found.
Since the error above talked about the DLL not being loaded,
I tried to register the DLL in question and got the below error:
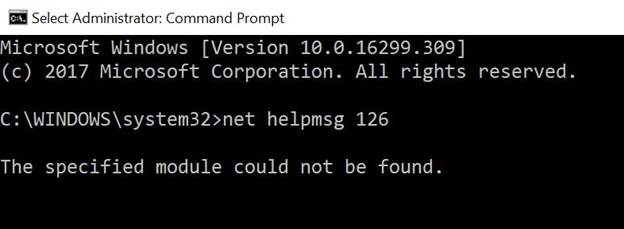
The module
“SQSRVRES.dll” failed to load.
Make sure the binary is stored at the specified
path or debug it to check for problems with the binary or dependent .DLL files.
The specified module could not be found.
This is the same what we saw in
cluster log earlier.
WORKAROUND/SOLUTION
By looking at various errors so far, I was concerned
if the SQL cluster related DLLs are actually present.
So, I tried to verify the same in the path C:\windows\system32 folder.
Surprisingly, I was not able to find sqsrvres.dll and sqagtres.dll.
Instead, both were renamed as,
sqsrvres2.dll
sqagtres2.dll
I renamed the DLLs to the required name sqsrvres.dll and sqagtres.dll.
After that, we were able to start SQL resource from Failover Cluster Manager. I
also rebooted the affected node so that all the resources come online on their
own so that all the DLLs loading happening automatically.
14) SQL SERVER
– Steps to Migrate Cluster Storage from Old Disks to Newly Attached Disks
One of my clients consulted me
for the best and easy method for migrating the Cluster Storage from old to
newly attached disks. They wanted to move/reconfigure disks mapped to SQL
Server, MSDTC, Quorum.
At present, they were using SQL
Server 2014 as a mission-critical database server in a cluster environment.
Storage being used was IBM DS 8300. They want to migrate the database from
current storage i.e. IBM DS 8300 to new storage IBM DS 8870.
|
Current
Disk Assignment |
Newly
Added Storage |
|
Disk
Q: Quorum Disk |
Disk
L |
|
Disk
X: MSDTC Disk |
Disk
M |
|
Disk
R: SQL Data disk |
Disk
N |
|
Disk
S: SQL Log disk |
Disk
O |
|
Disk
T: SQL TempDB disk |
Disk
P |
SOLUTION/WORKAROUND
My search on the internet combined with my
experience, I have come up with below plan for each component.
SQL Server databases can be
migrated on to the new storage by many ways:
- Backup and restore using “WITH MOVE”
option to the new storage.
- Detach,
Move and Attach the SQL database from the new storage.
The above process is tedious,
and your problem shoots up when you want to migrate the storage hosting the
System DBs as they need special care while moving to new storage/location. The
overall steps needed to accomplish the above task also becomes more. Below are
the steps outlined to ease out the above challenges and can also be done in a
very simple way.
- Take backups of all the databases
including System DBs. [ONLY for disaster
recovery]
- Present all the drives from the new
storage to the Windows Cluster. These disks must be visible under “Available
Storage” Failover Cluster Manager.
- Now add these disks to the SQL Cluster
Role/Group.
- From the SQL Server dependencies, remove
the drive letters pointing to the old storage.
- Take SQL Server Resource to an OFFLINE
State.
- e sure that the disks should be
online. Now start copying all the folders as is from old storage to the
new storage. <Bold>DO NOT change any files or folder
structures<Bold>.
Disk R: ==> Disk N
Disk S: ==> Disk O
Disk T: ==> Disk P - Once
all the files are copied, you need to swap the drive letters. Such that
the new drives will get the old drive letters and vice-versa [This can be
directly from Failover Cluster Manager]

For Ex:
- Change Disk R to Disk E
- Change Disk N to Disk R
- Add the disks to the SQL Server
dependencies.
- Bring the SQL Resource ONLINE.
- Test Application.
- Once Application testing is completed,
disks from old storage can be removed from the Failover Cluster Manager.
While starting the SQL Server resource in Failover cluster
manager, you may face this error,
initerrlog: Could not open error
log file ‘Drive:\pathname\MSSQL11.MSSQLSERVER\MSSQL\Log\ERRORLOG’. Operating
system error = 5(Access is denied.). Refer below to solve this issue.
Change Windows Cluster
Quorum Disk
- From the Start menu
(the Start screen on Windows 2012 operating systems),
click Administrative Tools.
- To launch the Failover Cluster Manager
snap-in, click Failover Cluster Manager.
- Right-click the cluster node and in the
context menu, select More Actions> Configure
Cluster Quorum Settings.
- The Configure Cluster QuorumWizard
appears.
- Click Next to continue.
- On the Select Quorum
Configuration Option panel, select Select
the quorum witness.
- Click Next to continue.
- On the Select Quorum
Witness panel, select Configure a disk witness and
then click Next.
- On the Configure Storage Witness panel,
select the disk group that is added for cluster quorum, and then
click Next.
- Review the report that the wizard
generates and click Finish to complete the operation.
Change MSDTC Disk:
The easiest way I have known is
to just re-configure MSDTC using the new disk.
- Remove the existing MSDTC Role
- Right-click on Roles and
pick the “Configure Role” option.
- A new window will open. Click “Next”.
- Choose the option “Distributed
Transaction Coordinator (DTC)” from the list. Click “Next”.
- Give a name for your MSDTC Role. Click “Next”
- Select the new disk which you want to
use. Click “Next”
- Click
“Next” to check the summary and then click “Finish”
These steps helped my client
migrate with very less downtime. The only downtime for SQL was to copy/paste
the file from old to new storage.
15) SQL SERVER
– Added New Node in Windows Cluster and AlwaysOn
Availability Databases Stopped Working
Almost all the time, whenever
there is a wizard, it’s a human habit to go with the defaults and finally click
finish. Once of my client sent below email to me. In this blog post we are
going to learn about Added New Node in Windows Cluster and AlwaysOn Availability Databases Stopped Working.
Hi Pinal,
We are trying to add new node to the AlwaysOn
Availability Group and for that we must add new node to Windows cluster. Before
doing this in production, we are trying to our test environment and we ran into
issues. We noticed that as soon as node is added in windows, our databases
which were part of an availability group went to not synchronizing state. Later
I noticed that local disks were added to the cluster under “available storage”.
Have you seen this
issue? What is wrong with our setup?
I asked for any error in event
log and they shared below.
Log Name: System
Source: Microsoft-Windows-FailoverClustering
Event ID: 1069
Task Category: Resource Control Manager
Level: Error
Description: Cluster resource ‘Cluster Disk 2’ of type ‘Physical Disk’ in
clustered role ‘Available Storage’ failed. The error code was ‘0x1’ (‘Incorrect
function.’)
I told them that they must have
followed the wizard and must have forgotten to “uncheck” the highlighted checkbox.
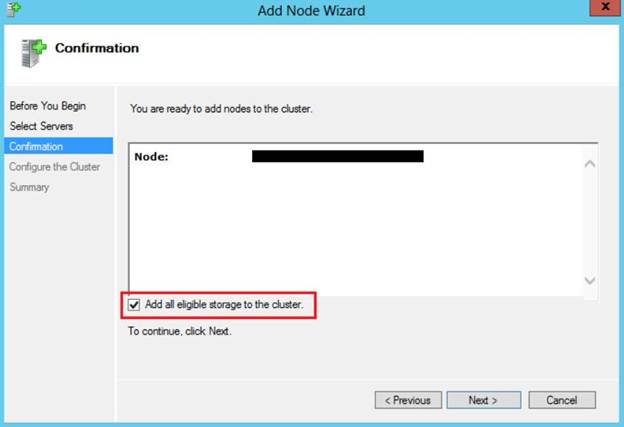
This is the default setting and has caused issues
for many, including me during the demo. They also confirmed the same. What is
the solution now?
SOLUTION/WORKAROUND
To work around this problem, we
must remove the disk resource from Failover Cluster Manager. Once done, we need
to bring these drives online in Disk Management once they are removed from
Failover Cluster Manager.