Interview Question
1) How to take sql Database backup faster
Ans: - Database backup compression feature
Script to use SQL backup
Increase throughput by adding more destination files
Faster SAN storage
2) SQL Server Start up Steps
1> As Sql Server goes through the startup process,
ERRORLOG file is updated with its progress. Open ERRORLOG and you get an insight into the startup sequence
2> Windows process ID
Server Process id is 2432
3> Authentication mode
Shows if the instance is enabled for mixed mode or just Windows Authentication
4> Start up parameters
-dE:\MSSQL10_50.MSSQLSERVER\MSSQL\DATA\master.mdf;
-lE:\MSSQL10_50.MSSQLSERVER\MSSQL\DATA\mastlog.ldf;
-eE:\MSSQL10_50.MSSQLSERVER\MSSQL\Log\ERRORLOG
5> Number of CPUs available for this instance
6> Amount of memory allocated.
7> Now starts system DB (master ,mssqlsystemresource ,msdb , model and tempdb )
8>Starts user databases
3) The reason SQL Server Instance that will not Start
· Service account password incorrect or account locked or disabled
· Corrupt or missing or inaccessible master database files
· Corrupt or missing or inaccessible model database files
· Unable to create tempDB / TempDB location does not exist
· Unable to open the error log /Missing Error Log Location
4) User reporting unable to connect SQL Server
· Check the Firewall and SQL Port
· Allowing Remote Connections for the SQL Database.
· Enabling TCP/IP within the SQL Configuration
· Check the credentials
·
5) New features in SQL 2017
· SQL Server on Linux
· Resumable online index rebuild
· SQL Server machine learning services
· Smart differential backup
· New dynamic management views (sys.dm_db_log_stats , sys.dm_db_log_info)
·
6) Few Replication issues
· Primary key violation
Once Replication Monitor is launched, you'll then need to drill-down to the publisher under "My Publishers", select the appropriate Publication, right-click and select "Agent Profiles “When the Agent Profiles window is displayed, make sure the "Distribution Agents" page is selected. Then in the Agent profiles section, click and select the "Default for New" checkbox for "Continue on data consistency errors".
· Agent job failed
· Distribution database growth
I was able to found out there are two jobs that are causing the issue and they were related to replication clean up.
Agent history clean up: distribution
Distribution clean up: distribution
After I identified and changed the retention days to 120 hours and ran the above job, the distributor database space used was reduced from 27GB to 300MB. After that I shrunk the database to 500MB and then I re-indexed all tables in the distribution database and ran the cleanup job again. Now, it takes less 3 sec to run the cleanup job. Also, replication as a whole is a lot faster.

7) SQL Server Installation Problems
· .MSI file missing (0 KB) (I re-extracted the ISO image after which I got the file in the correct state)
· Password is Invalid Message
8) Troubleshoot Database Mirroring issues
· Error: 1412: Occurs if we have not restored T.Log backup along with FULL backup in mirror server before configuring mirroring.
· Error: 1416, Database is not configured for database mirroring
You need to restore the Full backup from principal server using With NoRecovery option and also one T.log backup from principal server using With NoRecovery option and then start configuring mirroring.
- Error: 1418(Can’t be reached): Occurs due to the communication problems b/w the end points. Possible reasons are TCP/IP for the instance was not enabled, Duplicate end points exist, and Login was not created in their instance to mirroring.
9) Which Trace Flag Is Used in Mirroring?
· Trace flags are used to temporarily set specific server characteristics or to switch off/on a particular behavior. 1400 Trace flag is used in mirroring.
· To set trace flag for Database mirroring: - Configuration Manager > Right click on server instance > Properties > Advanced tab > Startup parameters > -t1400 (add)
10) What Is Hardening?
As quickly as possible, the log buffer is written to the transaction log on disk, a process called hardening.
11) OLTP and OLAP
OLTP and OLAP both are the online processing systems. OLTP is a transactional processing while OLAP is an analytical processing system. OLTP is a system that manages transaction-oriented applications on the internet for example, ATM. OLAP is an online system that reports to multidimensional analytical queries like financial reporting, forecasting, etc. The basic difference between OLTP and OLAP is that OLTP is an online database modifying system, whereas, OLAP is an online database query answering system.
Definition of OLTP
OLTP is an Online Transaction Processing system. The main focus of OLTP system is to record the current Update, Insertion and Deletion while transaction. The OLTP queries are simpler and short and hence require less time in processing, and also requires less space.
Definition of OLAP
OLAP is an Online Analytical Processing system. OLAP database stores historical data that has been inputted by OLTP. It allows a user to view different summaries of multi-dimensional data. Using OLAP, you can extract information from a large database and analyze it for decision making.
12) SQL Server Performance Tuning
SQL Server Performance Tuning and health check is a very challenging subject that requires expertise in Database Administration and Database Development. Here are few pointers how one can keep their SQL Server Performance Optimal. I am often asked what can one do keep SQL Server Health Optimal and SQL Server keep on running very smooth.
Here is the quick list of the pointers which one should consider for performance tuning.
Server/Instance Level Configuration Check
Review all the SQL Server/Instance Level settings of the server and tune it based on system workload.
I/O distribution Analysis
Analyze the I/O of your system and decide the best distribution for the I/O load. Perform object level analysis and do performance tuning at table level. Reduce I/O performance bottlenecks and suggest optimal setting for read and write database. This is especially critical for databases that need to sustain heavy updates during peak usage hours.
SQL Server Resource Wait Stats Analysis
Wait Stat Analysis is very crucial for optimizing databases, but is often overlooked due to lack of understanding. Perform advanced resource wait statistics analysis to proactively reduce performance bottleneck.
Index Analysis
Indexes are considered valuable for performance improvements. Analyze all your indexes to identify non-performing indexes and missing indexes that can improve performance.
TempDB Space Review
Review the size and usage of your TempDB database.
Database Files (MDF, NDF) and Log File Inspection
Review all the files and filegroups of each of your databases and analysis them to identify any object or files that are causing bottlenecks.
Fragmentations and Defragmentations
Identify the optimal settings of your database files and tables to reduce fragmentation and reduce them.
Backup and Recovery health Check
Review all backup & recovery settings and procedures of your databases and understand the functions of the respective databases.
Log Reviews (Windows Event Logs, SQL Server Error Logs and Agent Logs)
Logs reveal many hidden facts. Identity the critical errors and resolve them.
Hardware Review
Review the hardware and and verify that it positively impact the performance or scalability of the database.
DBCC Best Practices Implementations
There are few DBCC commands to be avoided and few very crucial for system. Understand the usage of DBCC FREEPROCCACHE, DBCC SRHINKDATABASE, DBCC SHRINKFILE, DBCC DROPCLEANBUFFER, DBCC REINDEX, as well as the usage of few system stored procedures like SP_UPDATESTATS. If you are currently using any of the above mentioned and a few other DBCC maintenance task commands carefully review their usage.
Deadlock Detection and Resolutions Hands-On
Detecting deadlock is not very difficult, but to learn the tips and trick to resolve them requires an understanding of the issue and some experience. Understand the locking mechanism and resolve them.
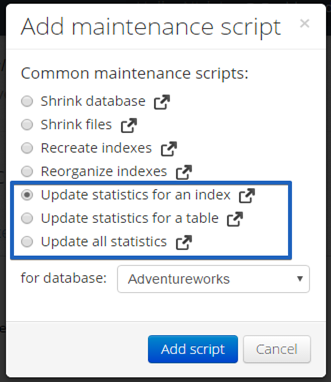
12) How to Update Statistics in SQL Server
Statistics are lightweight and small objects which describe how data in SQL Server tables are distributed. The query optimizer uses them to create query plans that improve query performance.
If you have AUTO_UPDATE_STATISTICS option turned on for the database the query optimizer will automatically determine when statistics might be out-of-date and then update them when they are used by a query. But you need to update your statistics manually when the automatic update does not occur frequently enough to provide you with a proper set of statistics or because the sampled nature of the automatic updates is causing your statistics to be inaccurate.
Updates query
optimization statistics on a table or indexed view. By default, the query
optimizer already updates statistics as necessary to improve the query plan; in some cases you can improve query performance by
using UPDATE STATISTICS or the stored procedure sp_updatestats to update statistics more frequently than
the default updates.
Updating statistics
ensures that queries compile with
up-to-date statistics. However,
updating statistics causes queries to
recompile. We recommend not
updating statistics too frequently because there is a performance
tradeoff between improving query plans and the time it takes to recompile
queries. The specific tradeoffs depend on your application. UPDATE
STATISTICS can use
tempdb to sort the sample of rows for building statistics.
We can do it manually

or just click on “Add from template” and select the one you need
13) MS SQL Server Transaction Log Architecture
A transaction log contains history of all the activities executed in database. From disaster recovery point of view, the transaction log file plays an important role. This transaction log guarantees ACID properties of MS SQL server at the time of system crash or failure. The different types of log files include Update Log Record, Compensation Log Record, Commit Record, Abort Record, Checkpoint Record and Completion Record. Let’s see logical and physical architecture of the transaction log files in detailed.

Transaction log file is a recursive file where the last virtual file points to first file at the start of the physical file. A new log record is appended at the end of the previous log and is expanded towards the end of physical log. Log truncation is the process of freeing any virtual log files whose records sequence number appears before the minimum recovery time stamp. When the end of the Physical file is reached, the logical files are mapped back to the start of the physical file. A transaction file is illustrated below in the figure for reference.

The looping is carried out endlessly; the old records are removed in order to create room for new virtual log records. This looping is carried out until the available disk space is finished. If multiple physical files exist, then logical logs will be traversed through the entire physical logs before it wrapped back to the first of the first physical file.
Transaction Log Logical Architecture
The SQL Server transaction log operates logically as if the transaction log is a string of log records. Each log record is identified by a log sequence number (LSN). Each new log record is written to the logical end of the log with an LSN that is higher than the LSN of the record before it. Log records are stored in a serial sequence as they are created. Each log record contains the ID of the transaction that it belongs to. For each transaction, all log records associated with the transaction are individually linked in a chain using backward pointers that speed the rollback of the transaction.
Transaction Log Physical Architecture
The transaction log in a database maps over one or more physical files. Conceptually, the log file is a string of log records. Physically, the sequence of log records is stored efficiently in the set of physical files that implement the transaction log. There must be at least one log file for each database.
The SQL Server Database Engine divides each physical log file internally into a number of virtual log files (VLFs). Virtual log files have no fixed size, and there is no fixed number of virtual log files for a physical log file. The Database Engine chooses the size of the virtual log files dynamically while it is creating or extending log files. The Database Engine tries to maintain a small number of virtual files. The size of the virtual files after a log file has been extended is the sum of the size of the existing log and the size of the new file increment. The size or number of virtual log files cannot be configured or set by administrators.
Virtual log file (VLF) creation follows this method:
· If the next growth is less than 1/8 of current log physical size, then create 1 VLF that covers the growth size (Starting with SQL Server 2014 (12.x))
· If the next growth is more than 1/8 of the current log size, then use the pre-2014 method:
o If growth is less than 64MB, create 4 VLFs that cover the growth size (e.g. for 1 MB growth, create four 256KB VLFs)
o If growth is from 64MB up to 1GB, create 8 VLFs that cover the growth size (e.g. for 512MB growth, create eight 64MB VLFs)
o If growth is larger than 1GB, create 16 VLFs that cover the growth size (e.g. for 8 GB growth, create sixteen 512MB VLFs)
Bottom Line
Every MS SQL Server databases have a transaction log that keeps all transactions and other activities done on the databases. These log files are critical component in case of system failure or of any mischievous activities at the SQL Server. One should never delete or move the log file unless you have full understanding of the file contents.
14) Do we update statistics before or after we rebuild/reorganize indexes?
Just remember that, when you create an index, part of the task of creating that index is to create the statistics using a full scan of the data. Since a rebuild of an index is effectively a ‘drop and recreate’ of the index, the statistics are also recreated. I’ve frequently seen maintenance scripts that rebuild indexes and then update statistics using sp_updatestats. This basically replaces a good set of statistics based on a full scan with a less-accurate set of statistics based on random sampling. So if you are rebuilding indexes, I would not recommend updating the statistics since this is extra work for a less effective statistic.
Now when you reorganize an index, no modifications of any kind are made to the statistics. So if you’ve had enough modifications to the data that you feel you should also update the statistics, go ahead and do it for indexes that you’ve reorganized because you won’t be hurting any other work.
If you absolutely must update the statistics and rebuild the indexes and you’re not going to try to tightly control exactly which indexes and tables you do this on, then the best practice would be to update the statistics first and then rebuild the indexes second.
15) If you ever need to know where your database files are located, run the following T-SQL code:
USE master;
SELECT name 'Logical Name', physical_name 'File Location'
FROM sys.master_files;
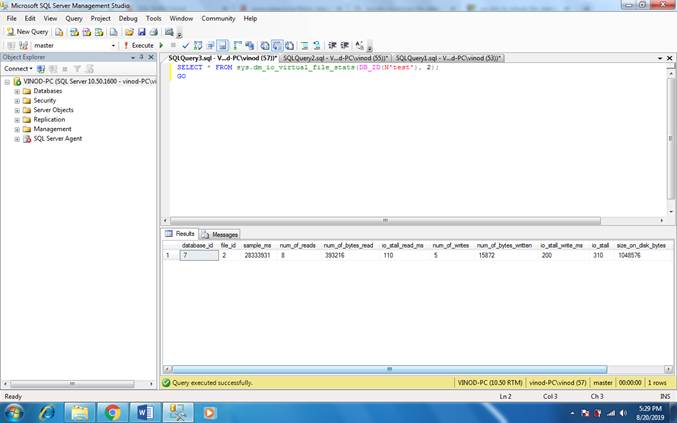
16) The following example returns statistics for the log file in the Test database.
SELECT * FROM sys.dm_io_virtual_file_stats(DB_ID(N'test'), 2);
GO
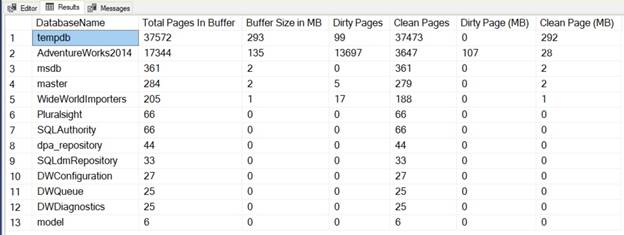
Here is the script for the database which will list all the dirty pages and clean pages in your database along with their size.
SELECT
DB_NAME(dm_os_buffer_descriptors.database_id) DatabaseName,
COUNT(*) AS [Total Pages In Buffer],
COUNT(*) * 8 / 1024 AS [Buffer Size in MB],
SUM(CASE dm_os_buffer_descriptors.is_modified
WHEN 1 THEN 1 ELSE 0
END) AS [Dirty Pages],
SUM(CASE dm_os_buffer_descriptors.is_modified
WHEN 1 THEN 0 ELSE 1
END) AS [Clean Pages],
SUM(CASE dm_os_buffer_descriptors.is_modified
WHEN 1 THEN 1 ELSE 0
END) * 8 / 1024 AS [Dirty Page (MB)],
SUM(CASE dm_os_buffer_descriptors.is_modified
WHEN 1 THEN 0 ELSE 1
END) * 8 / 1024 AS [Clean Page (MB)]
FROM sys.dm_os_buffer_descriptors
INNER JOIN sys.databases ON dm_os_buffer_descriptors.database_id = databases.database_id
GROUP BY DB_NAME(dm_os_buffer_descriptors.database_id)
ORDER BY [Total Pages In Buffer] DESC;
Result:-
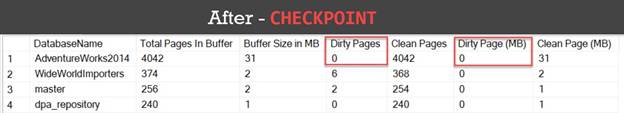
17) CHECKPOINT
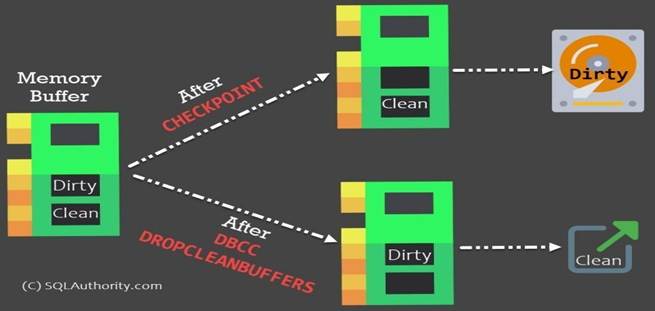
Checkpoint writes all the data pages that are in the buffer cache and modified (but yet not written to disk) to disk. In other words, this operation flushes all the modified dirty pages to the disk.
Let us see the impact of this particular keywords on the SQL Server memory.
|
1 2 |
|
18) DBCC DROPCLEANBUFFERS
Drop clean buffer operation removes all the buffers from the cache which contain the data already moved to the disk. In other words, this operation flushes out all the clean pages (which were dirty before CHECKPOINT executed) out of the memory.
|
1 2 |
|
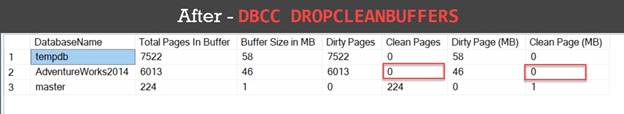
This particular command is specific to your server, and after running it, it will remove the clean pages from the buffer for all the databases.
NOTE: CHECKPOINT and DBCC DROPCLEANBUFFERS both should not be run on the production server without any specific reasons. While CHECKPOINT may not be as dangerous, DBCC DROPCLEANBUFFERS certainly may impact to lower your SQL Server performance temporarily till your cache is rebuilt.
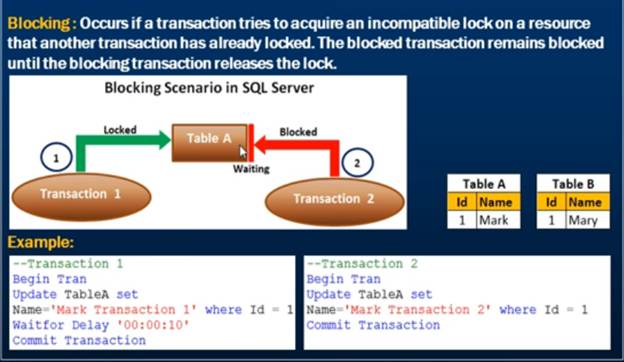
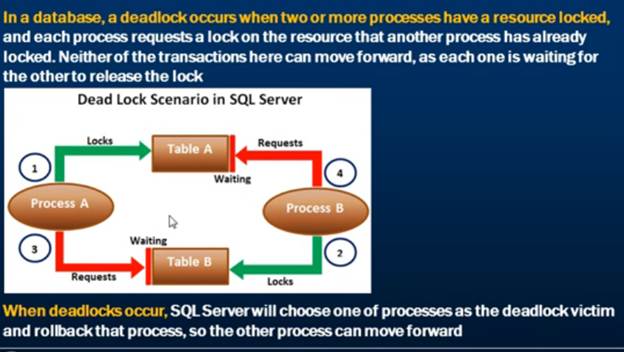
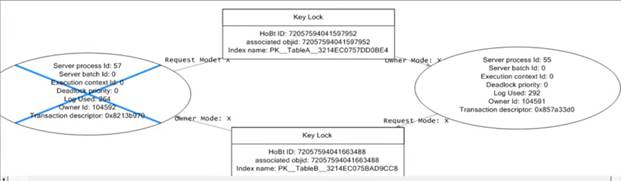
19) What is the difference between lock and deadlock?
When a session needs to wait for a resource being locked by another session, this process is called as blocking. e.g. If session “A” is waiting for a resource “R” being used by session “B” you can say that session “B” is blocking session “A”
Deadlock occurs when two sessions are waiting for a lock to clear on the other while holding it’s own resources. If session “A” has a lock on resource “R1” and waiting for resource “R2” and another session “B” has a lock on resource “R2” and waiting for resource “R1”,
A deadlock is terminated by the SQL Server engine itself by
using his own mechanism to decide which one of the process he will kill to let
the other process finish.
A blocking lock must be terminated by a human
intervention otherwise it will keep the lock forever
Locking Example:-
Deadlock Example:-
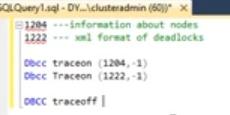 We can on/Off trace to find deadlock (1204 and
1222)
We can on/Off trace to find deadlock (1204 and
1222)
Execute sp_readerrorlog and review log file
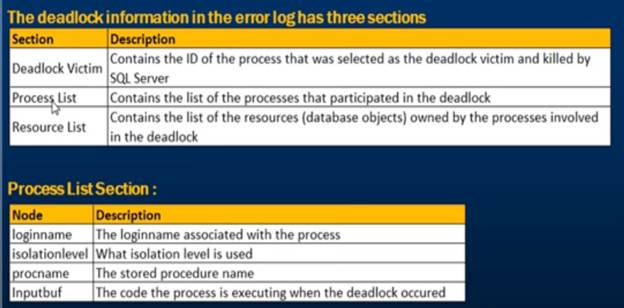
Example:-
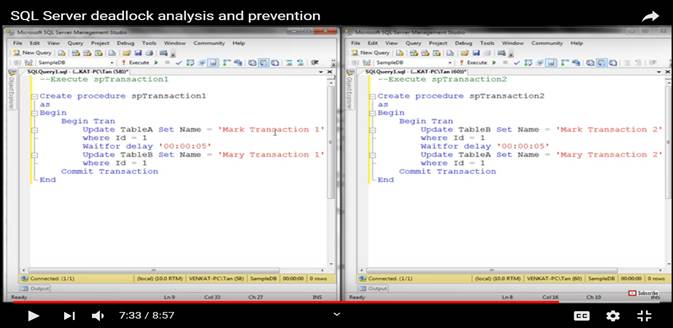
Capture Deadlock Graph through SQL Profiler:-
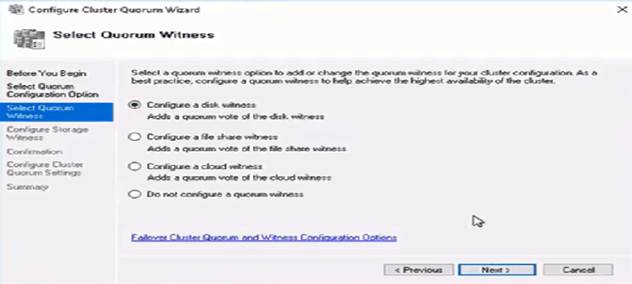
20) What is a cluster quorum?
Quorum is heart of the cluster without quorum we cannot bring cluster online. If we lose quorum we need to rebuild cluster. In quorum there is setting for how many nodes are there, where to failover, when to failover and all configuration.
Imagine that quorum doesn’t exist and you have two-nodes cluster. Now there is a network problem and the two nodes can’t communicate. If there is no Quorum, what prevents both nodes to operate independently and take disks ownership on each side? This situation is called Split-Brain. Quorum exists to avoid Split-Brain and prevents corruption on disks.
To select Quorum witness
§ Disk Witness
§ File share witness
§ Cloud witness

The following table breaks down the quorum models in Windows Server 2016 and recommendations based on each cluster's characteristics.
|
Quorum model |
Voting |
When cluster is active |
When to choose this model |
|
Node majority |
Only nodes can participate in the cluster voting. |
If more than half of the nodes are available. |
If the cluster contains an odd number of nodes.(3,5,7,9 Nodes Clusters) |
|
Node and disk majority |
Cluster nodes and the disk participate in the cluster voting. |
If more than half of the nodes are available. |
If the cluster contains an even number of nodes.(2,4,6,8 nodes clusters) |
|
Node and file share majority |
The cluster nodes and file share participate in the clustering voting process. |
If more than half of the nodes are available. |
If the cluster contains an even number of nodes. This is typically used when a cluster spans multiple sites. |
|
Disk only |
Only the disk participates in the voting process. |
Only if the disk is online. |
If the cluster contains an even number of nodes without shared storage. |
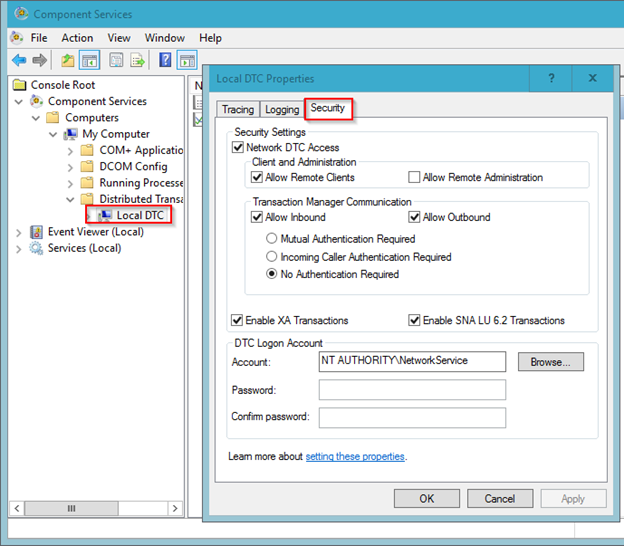
21) MSDTC is an acronym for Microsoft Distributed Transaction Coordinator
MSDTC is used by SQL Server and other applications when they want to make a distributed transaction between more than one machines. A distributed transaction is simple a transactions which spans between two or more machines. The basic concept is that machine 1 starts a transaction, and does some work. It then connects to machine 2 and does some work. The work on machine 2 fails, and is canceled. The work on machine 1 needs to then be rolled back.
1. Open Failover Cluster Manager and Right-click on Roles and pick the “Configure Role” option.
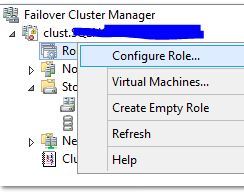
Select the Security tab. In this tab, select all of the following:
· Network DTC Access
· Allow Remote Clients
· Allow Inbound
· Allow Outbound
· No Authentication Required