Wait
stats
Basically, wait types are
nothing but wait performed to execute any task created by SQL Server. As per
BOL, there are three types of wait types, namely:
- Resource Waits. Resource waits
occur when a worker requests access to a resource that is not available
because that resource is either currently used by another worker, or it’s
not yet available.
- Queue Waits. Queue waits
occur when a worker is idle, waiting for work to be assigned.
- External Waits. External waits occur when an SQL
Server worker is waiting for an external event.
Supports essential
metrics for diagnosing SQL Server performance problems. If you have some
issues (CPU, Memory, I/O, Lock, Latch etc.) in SQL Server Engine, sys.dm_os_wait_stats data guides us to define the problem.
Activity Monitor in SQL Server Management Studio includes a panel named as “Resource Waits”.
“Resource Waits” gets these metrics from a special stored procedure. This
temporary stored procedure name is “#am_generate_waitstats” and it uses sys.dm_os_wait_stats. You can find this temporary stored
procedure in “tempdb”
More than
800 Waits types
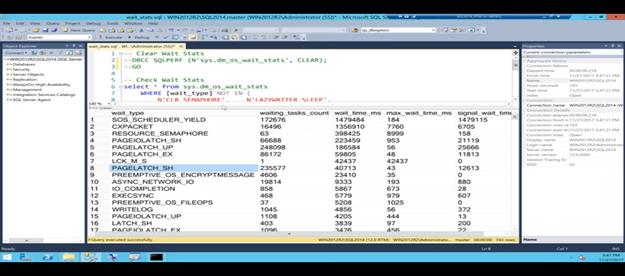
Clear Wait Stats
DBCC SQLPERF (N'sys.dm_os_wait_stats', CLEAR);
GO
Useful DMVs in cases
above that can help us identify bottlenecks with I/O are:
DMV - sys.dm_io_virtual_file_stats
This DMV will give you cumulative file stats
for each database and each database file including both the data and log
files. Based on this data you can determine which file is the busiest
from a read and/or write perspective.

In
the best practice, the several wait statistics are most important than the
others. These can be listed as:
PAGEIOLATCH_*
ASYNC_NETWORK_IO
CXPACKET
LCK_M_*
PAGELATCH_*

PAGEIOLATCH_*
A
PAGEIOLATCH wait occurs when a user requests a page that is not in the buffer
cache. SQL Server uses a PAGIOLATCH_EX on a free space in the buffer
cache and transfers the requested page from disk into memory. Next to the
PAGEIOLATCH_EX a PAGEIOLATCH_SH is placed on the place in the buffer cache so
the user can read the page from the buffer after it has been transferred there
and the PAGEIOLATCH_EX is released. The PAGEIOLATCH_SH is removed after the
user is finished reading the page from the buffer cache.
- PAGEIOLATCH_SH – (SHare) waiting for a data file page to be
brought from disk into the buffer pool so its contents can be read
- PAGEIOLATCH_EX or PAGEIOLATCH_UP – (EXclusive or UPdate)
waiting for a data file page to be brought from disk into the buffer pool
so its contents can be modified
To fix it, it’ll list the queries reading the most data. Look for missing indexes in those query plans, or
non-sargable things in the query that you could tune
manually.
ASYNC_NETWORK_IO
This wait type is where SQL Server has sent some data to a
client through TDS and is waiting for the client to acknowledge that is has
consumed the data, and can also show up with transaction replication if the Log
Reader Agent job is running slowly for some reason, plus MARS or BCP inbound.
If there
are significant wait times on ASYNC_NETWORK_IO you have the following options:
Review the queries and identify large result
sets. Verify that the client application is consuming data as efficiently as
possible. For example, if the application is asking for a million rows of data
but only processing one row at a time.
If the above tuning tips
are reviewed and applied, but the server is still encountering high wait times,
then ensure there aren’t any network-related
issues:
- Validate
the network components between the application/clients and the SQL Server
instance (router, for example).
- Look
at your NIC configuration on the server to make sure there are no issues
with the physical card. Also, check if autodetect
is picking the fastest speed.
- Check
network adapter bandwidth: 1 Gigabit is better than 100 megabits, and 100
megabits is better than 10 megabits.
CXPACKET
A parallelized query is divided and distributed to
several threads. If one of these threads run slower than the others, all
threads but the slower will register CXPACKET waits, a complaint about waiting
for the slower one.
Doesn’t CXPACKET means a problem with parallelism?
A configuration problem with parallelism can cause CXPACKET waits,
however, usually will be the cause of only part of the amount of the CXPACKET waits not
all of them.
You need to take care of two
important configurations:
- If your query uses too many threads, the
overhead of managing the threads can affect the performance, instead of
improving it. You can control the number of threads configuring the ‘Max degree of
parallelism’.
- If small queries run in parallel, they
will consume more than they would with a serialized execution. We can
control this by tunning ‘Cost Threshold for parallelism’, setting the minimal cost for a query to be executed in
parallel. The ‘Cost’ is a custom SQL
Server measure, it’s not measured in time as many mistakenly think.
·
Mixed System (OLTP & OLAP): Here
is the challenge. The right balance has to be found. I have taken a very simple
approach. I set the “Maximum Degree of Parallelism” to 2, which means the query
still uses parallelism but only on 2 CPUs. However, I keep the “Cost Threshold
for Parallelism” very high. This way, not all the queries will qualify for parallelism
but only the query with higher cost will go for parallelism. I have found this
to work best for a system that has OLTP queries and also where the reporting
server is set up.
·
Here, I am setting ‘Cost Threshold for Parallelism’
to 25 values (which is just for illustration); you can choose any value, and
you can find it out by experimenting with the system only. In the following
script, I am setting the ‘Max Degree of Parallelism’ to 2, which indicates that
the query that will have a higher cost (here, more than 25) will qualify for
parallel query to run on 2 CPUs. This implies that regardless of the number of
CPUs, the query will select any two CPUs to execute itself.
EXEC sys.sp_configure N'cost threshold for parallelism', N'25'
GO
EXEC sys.sp_configure N'max degree of parallelism', N'2'
GO
RECONFIGURE WITH OVERRIDE
GO
LCK_M_X
This wait type is when a thread is waiting to acquire an Exclusive lock on a resource and there is at least one other lock in an incompatible mode granted on the resource to a different thread.
It means one query is holding locks on an object, and another
query is waiting to get locks on that same object. Maybe one query is trying to
update all the rows in the Customers table, and another query is trying to read
them.
To fix it, Check the isolation levels for your transactions and update the locking
and row versioning behavior if necessary.
PAGELATCH
Page Latches are used to guarantee consistency
of index and data pages for user and system objects in-memory. Pages that manage
allocations are protected by internal allocation pages (PFS, GAM, SGAM and
IAM). This wait type accumulates while page latches are in share/read mode. If
this wait type is high then the common problem of PFS contention may be present
PAGELATCH_SH – (SHare) waiting for access to a data file page in
memory so that the page contents can be read
PAGELATCH_EX or PAGELATCH_UP – (EXclusive or UPdate)
waiting for access to a data file page in memory so that the page contents can
be modified
Suggested solutions
- Monitor
page latches over time, confirm which database the problem is coming from.
It is most likely tempdb
- Ensure
tempdb has the correct number of data files. A
rule of thumb is one file for every 4 CPU cores
- Enable
trace flag 1118
LATCH: - A latch
can only acquire when you read or write the pages in memory. Latches are
internal to the SQL engine and are used to provide memory consistency
RESOURCE_SEMAPHORE
Occurs while query memory requests cannot be
granted due to other concurrent queries. High values of this wait type may
indicate excessive number of concurrent queries, or excessive memory requests
- Ensure
that statistics are up to date
- Run
a trace/Profiler/Extended Event session along with Windows Performance
Monitor to determine which queries require an excessive amount of memory
- Indexing,
look for high duration queries with large sorts and hash joins
- If
possible rewrite queries to avoid large UNION, DISTINCT and ORDER BY
operations
- Increase
the maximum memory allocation
Transact-SQL
1) SELECT * FROM sys.dm_os_wait_stats ORDER BY wait_time_ms DESC
2)Select * from sys.dm_os_waiting_tasks
where wait_type LIKE
'PAGEIOLATCH%'
SQL Server I/O Bottlenecks
I/O Bottleneck
SQL Server performance highly relies on the Disk
performance. SQL Server I/O Bottleneck can be identified through
1. PAGEIOLATCH_xx or WRITELOG wait
types in Sysprocesses and other DMV’s
2. I/O taking longer than 15 seconds in SQL Server Errorlog.
{
SQL
Server has encountered X
occurrence(s) of I/O requests taking longer than 15 seconds to complete on
file [L:\mssql\data\File.ldf]
in database [IOTEST (7). The OS
file handle is 0x000006A4. The offset of the latest long I/O is:
0x000001e616fa00
}
3. By looking at I/O latch wait statistics in sys.dm_os_wait_stats
{
Select wait_type,
waiting_tasks_count,
wait_time_ms
from sys.dm_os_wait_stats
where wait_type like ‘PAGEIOLATCH%’
order by wait_type
}
Following are
common reasons for I/O Bottleneck in SQL Server.
1. SQL Server is spawning more I/O requests than what I/O disk
subsystem could handle.
2 . There could be an
Issue with I/O subsystem (or) driver/firmware issue (or) Misconfiguration in
I/O Subsystem (or) Compression and so the Disks
are performing very slow and hence SQL Server is affected.
3. Some other process on the system is saturating the disks with
I/O requests. Common application includes AV Scan,System Backup Etc. So I/O requests posted by SQL
Server becomes slow.
How to troubleshoot?
1. Exclude SQL Server files from antivirus scan.
2. Do not place SQL Server FILES on compressed drives.
3. Distribute SQL Server data files and transaction log files
across drives.
4. If the “I/O request taking longer” warning is for tempdb ,
Enable trace flag 1118 and increase the tempdb data
files refer:http://support.microsoft.com/kb/2154845
5. If none of the above resolves the issue collect the below perfmon counters.
Perfmon
counters can help us in understanding “If disk is slow” or
“SQL Server is spawning more I/O then what disk could handle” or “Some
other process is saturating disk with I/O”
Note:It is important to get throughput of the disk subsystem in MB/SEC before we look at disk counters. Normally it will be more than 150 MB for SAN disk and greater 50 MB for Single disk .When you look at the perfmon counter look at Max value.